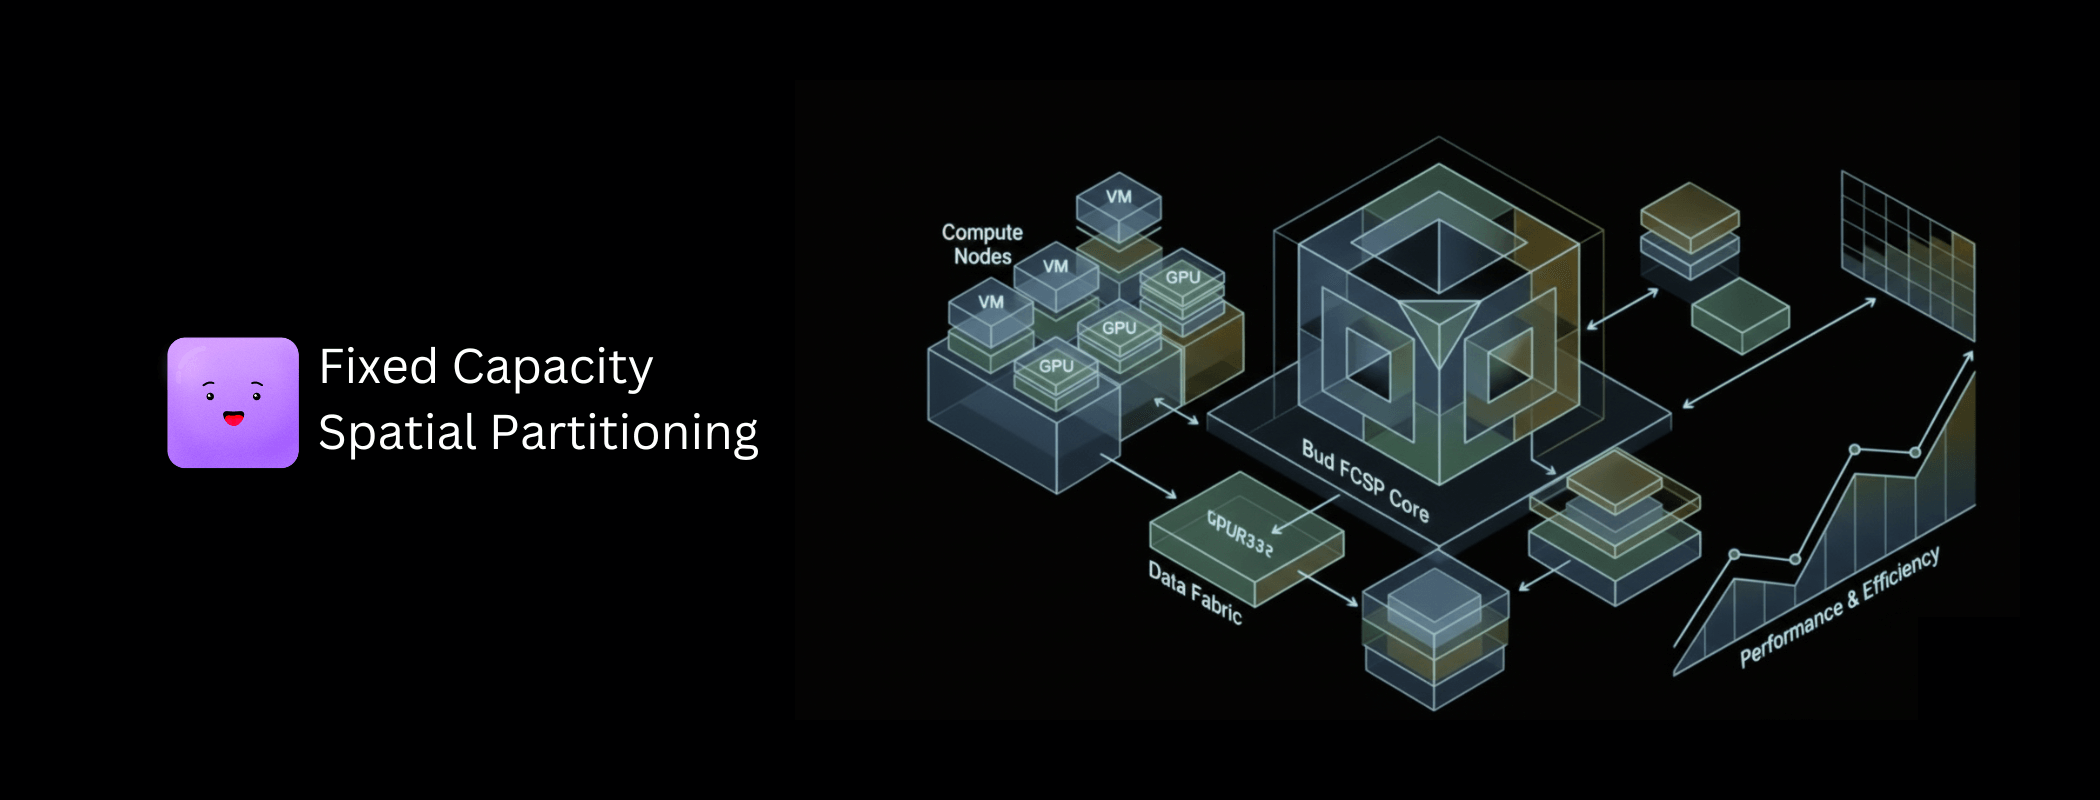
We have open-sourced GPU-Virt-Bench, a benchmarking framework for evaluating software-based GPU virtualization systems — HAMi-core, BUD-FCSP, and comparison against ideal MIG behaviour. It evaluates 56 metrics across 10 categories.
Open source BudEcosystem/GPU-Virt-Bench The full suite, the metric catalogue, and the comparison harness →Why benchmark GPU virtualization at all?
When several applications or tenants run on the same GPU, the system can become unstable and unpredictable. Instead of improving efficiency, shared access often introduces performance, fairness and reliability problems that are difficult to diagnose or control.
- Noisy-neighbour slowdowns. One workload hogs bandwidth or compute, and everything else runs measurably slower.
- Unfair resource allocation. The GPU divides compute or memory unevenly, giving some tasks more than they need while starving others.
- Poor performance for large models. LLM workloads degrade sharply under contention, missing expected throughput or latency.
- Incorrectly enforced limits. Memory or compute caps get misapplied — processes exceed boundaries, or get throttled far too aggressively.
- Instability and crashes. Competing tasks overload shared resources and the driver or scheduler fails, taking the whole system down.
Different virtualization frameworks address these to different degrees, and none is universal — what performs well on one system behaves poorly on another. GPU-Virt-Bench lets you evaluate them side by side under consistent conditions. The current version compares no virtualization as a baseline, the original HAMi-core implementation, the BUD-FCSP implementation, and simulated ideal MIG behaviour.
How it works
The suite runs uniform tests across your hardware, models and workloads, producing data-driven comparisons that expose trade-offs, bottlenecks and real behaviour under load.
- Structured performance tests. Workloads from tiny CUDA kernels up to full LLM inference, recording how fast, slow or stable the GPU behaves in each condition.
- System comparison. Native, HAMi-core, BUD-FCSP and other vGPU setups evaluated side by side, showing exactly how much overhead each introduces.
- Isolation and fairness checks. Whether a tenant's slice is genuinely protected: do others cause slowdowns, do spikes bleed across boundaries, is there memory or compute interference?
- LLM-relevant measurements. Token generation speed, attention kernel throughput, KV-cache behaviour, and multi-stream or multi-model concurrency — grounded in real deployment needs rather than synthetic metrics.
- Comparable reports. Machine-readable JSON and tables, so engineers can compare frameworks, spot regressions and design allocation policy from evidence.
The ten categories
Tests are grouped so performance and isolation can be evaluated apples-to-apples, each category holding multiple metrics.
| Category | What it measures |
|---|---|
| Overhead | The extra latency or slowdown virtualization itself introduces. |
| Isolation / noisy neighbour | Whether one tenant can negatively affect another. |
| LLM-specific | Token latency, attention throughput, KV-cache performance. |
| Memory & bandwidth | Read/write speed, fragmentation, allocator behaviour. |
| Cache behaviour | How virtualization affects L1/L2 usage and eviction. |
| PCIe / interconnect | PCIe bandwidth, host-device transfer overhead, NUMA effects. |
| NCCL / multi-GPU scaling | Effect on distributed training and inference throughput. |
| Scheduling & fairness | How time slices and scheduling decisions affect jitter and latency. |
| Fragmentation & utilisation | How well memory and compute are partitioned between tenants. |
| Error recovery / stability | Robustness under faults, OOM events and heavy concurrency. |
Who uses it, and for what
Infrastructure and virtualization engineering
Run the same hardware and workloads across native, HAMi-core and BUD-FCSP, then use the JSON output and --compare mode to see exactly where one outperforms, matches or falls behind another. Overhead metrics — API interception, memory tracking, rate-limiter cost — show which subsystems add latency, so optimisation effort goes where it pays.
LLM platform and serving teams
The LLM metrics — attention throughput, token generation latency, multi-stream performance, multi-GPU scaling — describe the real performance envelope you can commit to in an SLA when models run on virtualized GPUs. Measuring KV-cache allocation speed and batching behaviour under virtualization validates whether your allocators or schedulers degrade once slices are shared.
Cloud and cluster operators
Isolation and bandwidth metrics reveal how well the stack isolates tenants and whether performance leaks across boundaries. Adjusting process count, memory limits and compute limits lets operators explore safely how far GPUs can be over-subscribed, then turn the findings into scheduling policy.
Research and regression testing
With metrics grouped into structured categories, results export directly into papers and evaluations, and the framework provides vendor-neutral, reproducible evidence for customer conversations. Integrated into CI, a selected metric set runs on every change to the virtualization stack, catching regressions long before production.
A 30-minute walkthrough on your hardware mix, governance constraints, and top use case.
Running a comparison
Run the suite against each backend on the same hardware, then diff the results.
# same hardware, three backends
./gpu-virt-bench --system native
./gpu-virt-bench --system hami
./gpu-virt-bench --system fcsp

# then diff the JSON, or use the built-in comparison mode
./gpu-virt-bench --compare
JSON reports contain raw metrics, category groupings, per-system comparisons and timestamped runs — parseable with Python, visualisable in dashboards, or stored as baselines for regression detection.
What it does and does not tell you
Out of the box the suite includes CUDA microbenchmarks, bandwidth and memory tests, cache and PCIe tests, and LLM workloads covering token generation and attention kernels. It is extensible: custom CUDA kernels, your own inference workloads and proprietary model tests can all be integrated.
The isolation tests run two or more workloads simultaneously against specific GPU subsystems and record whether one slows down, jitters or loses bandwidth. Contention is configurable — number of tenants, memory limits, compute limits, workload intensity, and the type of interfering job — so you can model anything from mild contention to a genuinely hostile neighbour.
They are designed to reflect real inference bottlenecks, because they measure the things that actually bottleneck: token latency, attention throughput, KV-cache performance, multi-model concurrency, multi-GPU scaling.
Absolute accuracy still depends on your model implementation, tokenizer and runtime, hardware backend, and the specifics of the virtualization system. Treat the numbers as comparative, not absolute.
- Traditional GPU benchmarks measure compute; they say nothing about behaviour under sharing.
- 56 metrics in 10 categories, run identically across native, HAMi-core, FCSP and simulated MIG.
- JSON output makes it CI-friendly, so virtualization regressions get caught before production.
GPU-Virt-Bench is released open source; results depend on the hardware, driver, model runtime and virtualization backend under test, and are meaningful as comparisons within a single run rather than as absolute figures across environments. The MIG comparison point is simulated ideal behaviour, not a measurement of a MIG-partitioned card.