A GPU hall is the most expensive room a sovereign or regulated organisation will ever build, and the first time anyone sees how it behaves under a fault is usually the first time it carries real work. DC Twin, a new feature in Bud GPU Foundry, changes that order. It is a living replica of your AI data centre: you design the hall in it, break things in it, and rehearse the recovery, all before the real facility goes live.
Why on-premise AI is a big first step
More organisations are choosing to run AI on their own infrastructure. They want their data to stay inside their own environment, they have regulatory requirements to meet, and they want to stay in control of the systems that power their AI. Government departments, banks, defence bodies and the wider public sector are all moving in this direction.
The difficulty is that standing up on-premise AI infrastructure for the first time is a different kind of project from renting capacity. A modern GPU rack draws a very large amount of power and many now depend on liquid cooling. The network, the power chain and the cooling loops all have to agree with each other, and the team that will operate the hall has often never run one. Most of what can go wrong only shows itself when something fails, and nobody wants to find out on live workloads.
DC Twin is built for that gap. It lets you see how the facility will behave, test it, and get your team ready while the cost of a mistake is still a changed setting rather than a changed purchase order.
What DC Twin is
DC Twin is a digital twin of an AI data centre, delivered as part of Bud GPU Foundry, the control plane for GPU capacity (the whitepaper covers it in depth, and the product brief is the shorter read). It models compute, networking, power and cooling together, as one connected facility rather than four separate diagrams. Four properties set it apart from a static drawing or a spreadsheet of rack counts:
- It behaves like the real thing. The twin responds the way your equipment would, and it uses the same kind of signals your operations team already works with every day.
- It is multi-vendor. Different types of accelerators sit side by side in one hall, as they often do in real facilities, so you are not tied to a single supplier's way of doing things.
- You can break it. Failures can be injected on purpose, on a GPU, a cable, a power feed or a cooling loop, without putting any live workload at risk.
- It checks your design as you go. If you are still planning, it tells you whether the power, cooling and network capacity are there to support what you have laid out.
The interface is organised into five tabs: Operate, Topology, Facility, Scenarios and Design. We will take them in the order the walkthrough does.
Operate: the whole hall at a glance
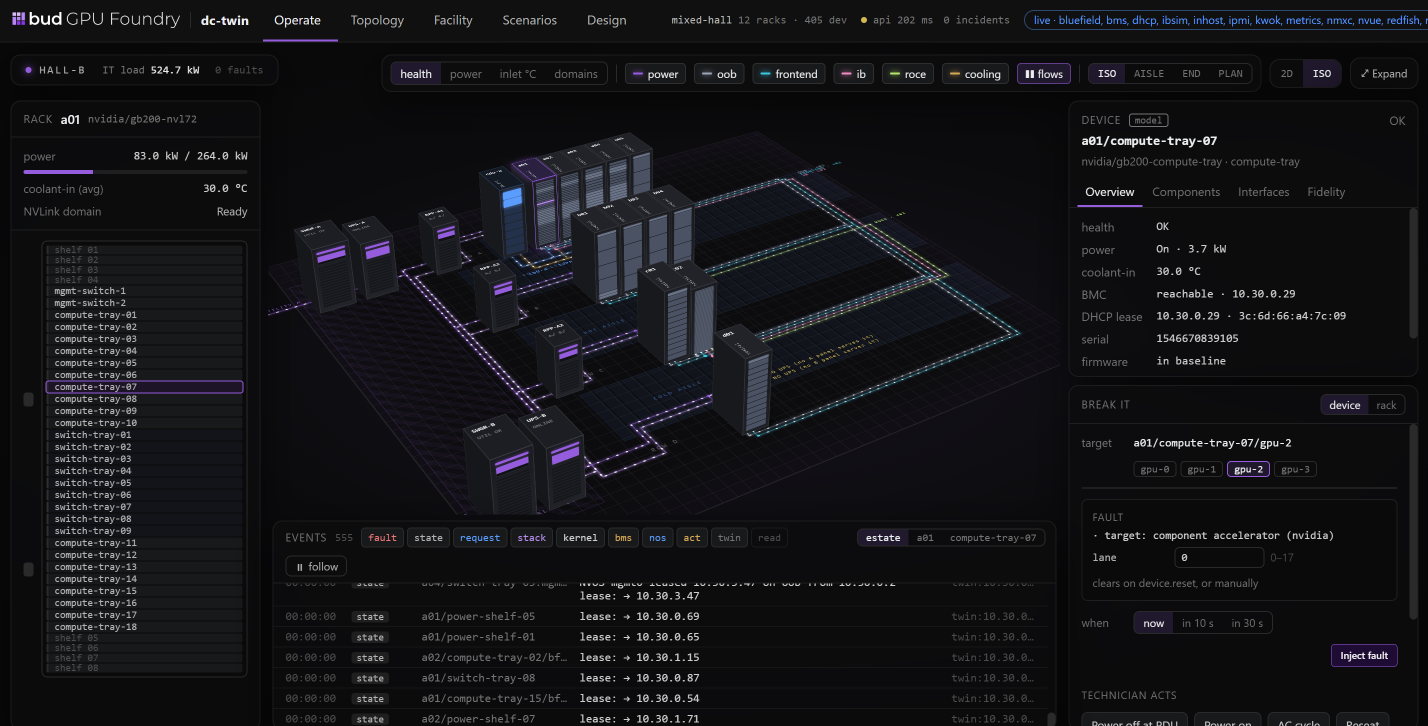
The Operate tab is where you see the entire facility at once. In the example above the twin is running a mixed hall of 12 racks and 405 devices. It holds NVIDIA GB200 NVL72 racks, HGX 8-GPU racks and Intel Gaudi 3 racks together, with the power, out-of-band, frontend, InfiniBand, RoCE and cooling paths drawn through the hall in the same 3D view. The status strip along the top shows which signal sources are live, including Redfish, IPMI, DHCP and metrics, and the total IT load of the hall.
From here you can move from the whole hall to a single server in a couple of clicks. Pick a rack, pick a compute tray, and its health, power draw, coolant temperature, BMC reachability, DHCP lease, serial number and firmware state are in one panel. For an operations team that means less time searching across different tools to understand what is happening, and more time fixing it.
Break it, then recover it
In a real data centre you would never deliberately break something just to see what happens. In the twin you can. The Operate tab has a Break It panel: choose a target, such as one GPU on one compute tray, choose a fault, choose when it fires, and inject it.
The twin reacts immediately, and you can see how the problem shows up and what it affects. Then you respond the way a technician would. The same view carries the technician actions, such as powering off at the PDU, powering on, an AC cycle or a reset, and you watch the system recover.
Your team can rehearse its response to failures before they ever happen in production. They learn what a real incident looks like, how long recovery takes, and which steps actually work, without risking a single live workload.
Topology: pull a cable and see who notices
The Topology tab shows how the whole network is connected, from the core switches down to every rack. You can switch between the fabrics in the hall: backend InfiniBand, backend RoCE, frontend and out-of-band. The frontend fabric in the example is a two-tier design with 4 spines, 22 leaves and 392 cables. Below the graph, the NVLink domain view shows the state of a rack's internal fabric.
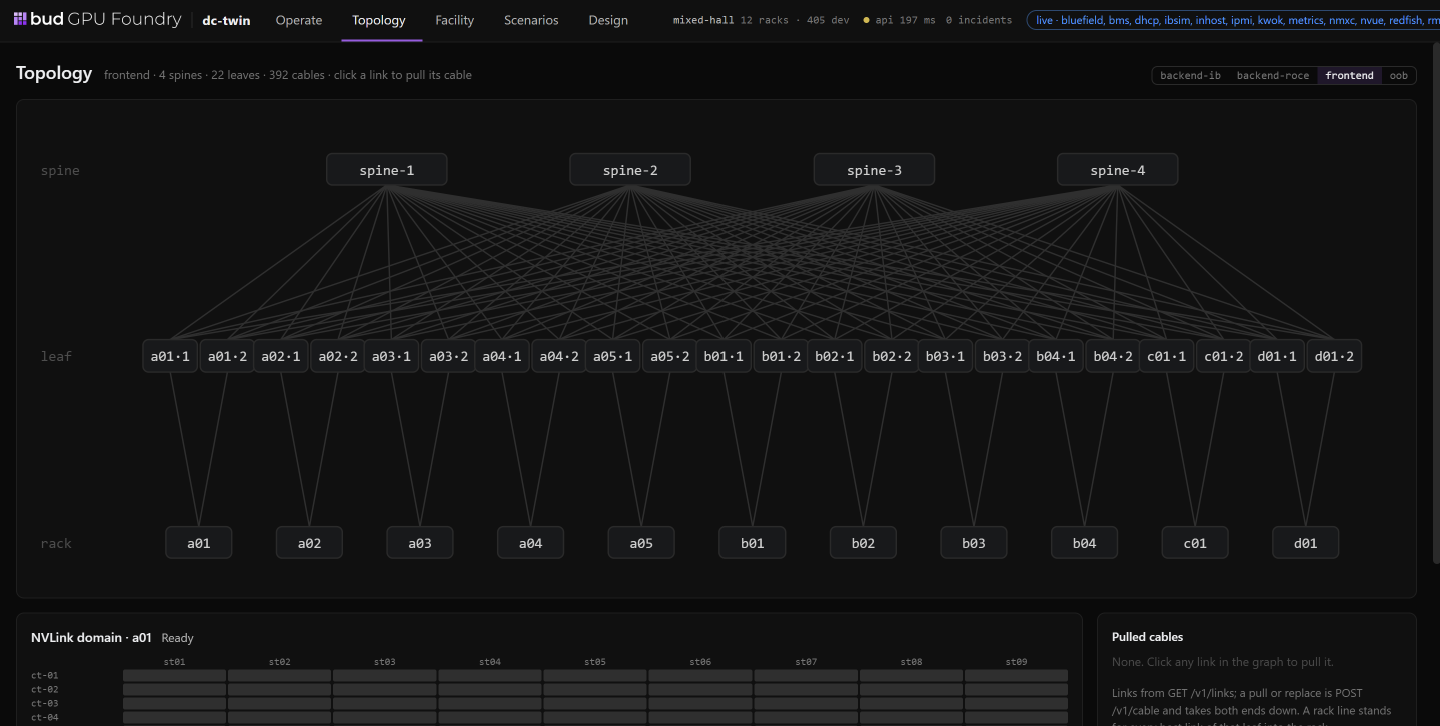
Click a link and you pull its cable. The twin shows straight away which parts of the cluster are affected. It is a simple way to find the weak points in a design and to confirm that your redundancy does what you expect, before a cable is ever run.
Facility: power and cooling, with the same rigour as compute
AI infrastructure is as much about power and cooling as it is about compute. The Facility tab follows power from the utility feed down to every rack, and shows whether cooling is keeping up with the load.
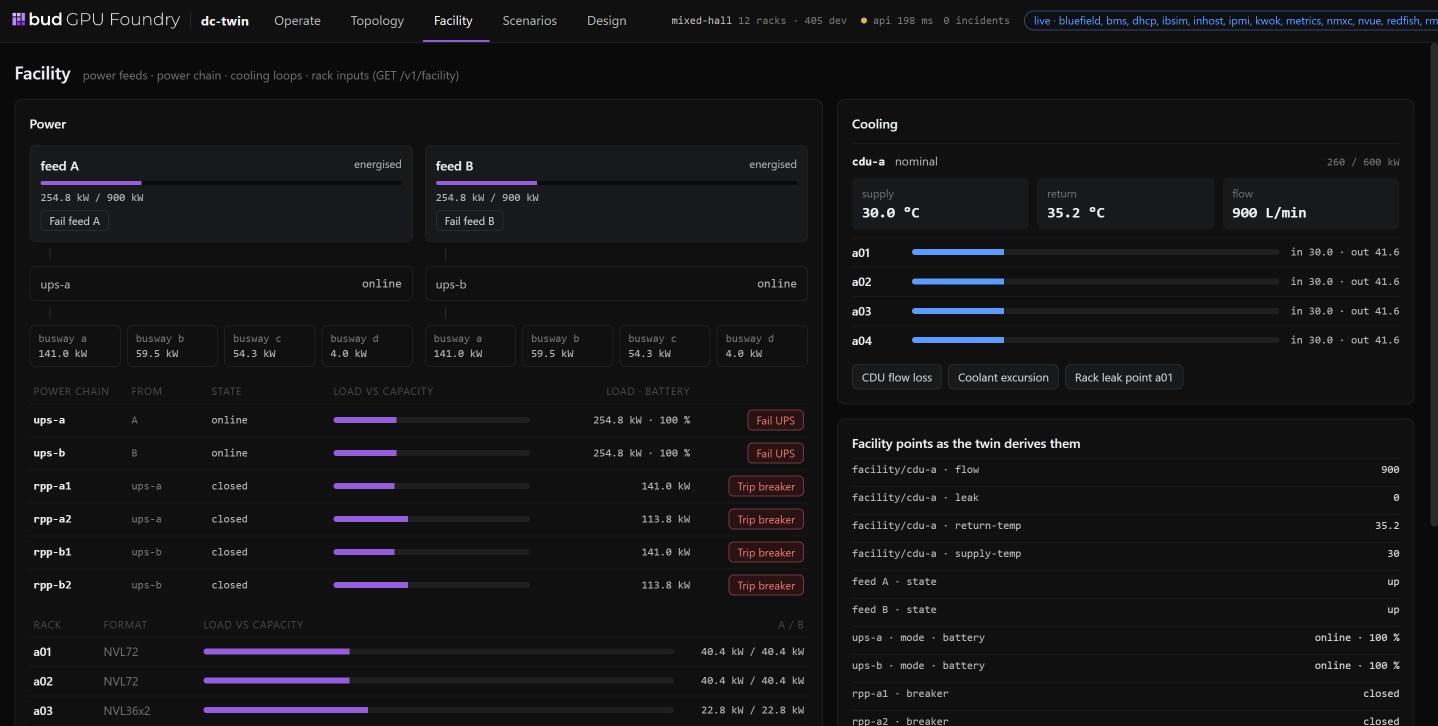
The power side runs two independent feeds, A and B, each through its own UPS, busways and breakers, with each rack's load shown against its capacity on both sides. The cooling side shows a coolant distribution unit with its supply and return temperatures and flow, and the coolant temperature going into each rack. Next to both are the controls that make it a test bench rather than a dashboard: fail a feed, fail a UPS, trip a breaker, lose CDU flow, cause a coolant excursion, open a leak at a rack.
That way the facility team and the IT team can plan for those moments together, rather than discovering them during an outage.
Scenarios: turn a rehearsal into a repeatable test
Once you know how you want the system to respond, the Scenarios tab lets you write that down as a test. A scenario describes a failure and the recovery you expect. The twin runs it automatically and reports back on whether everything behaved as it should.
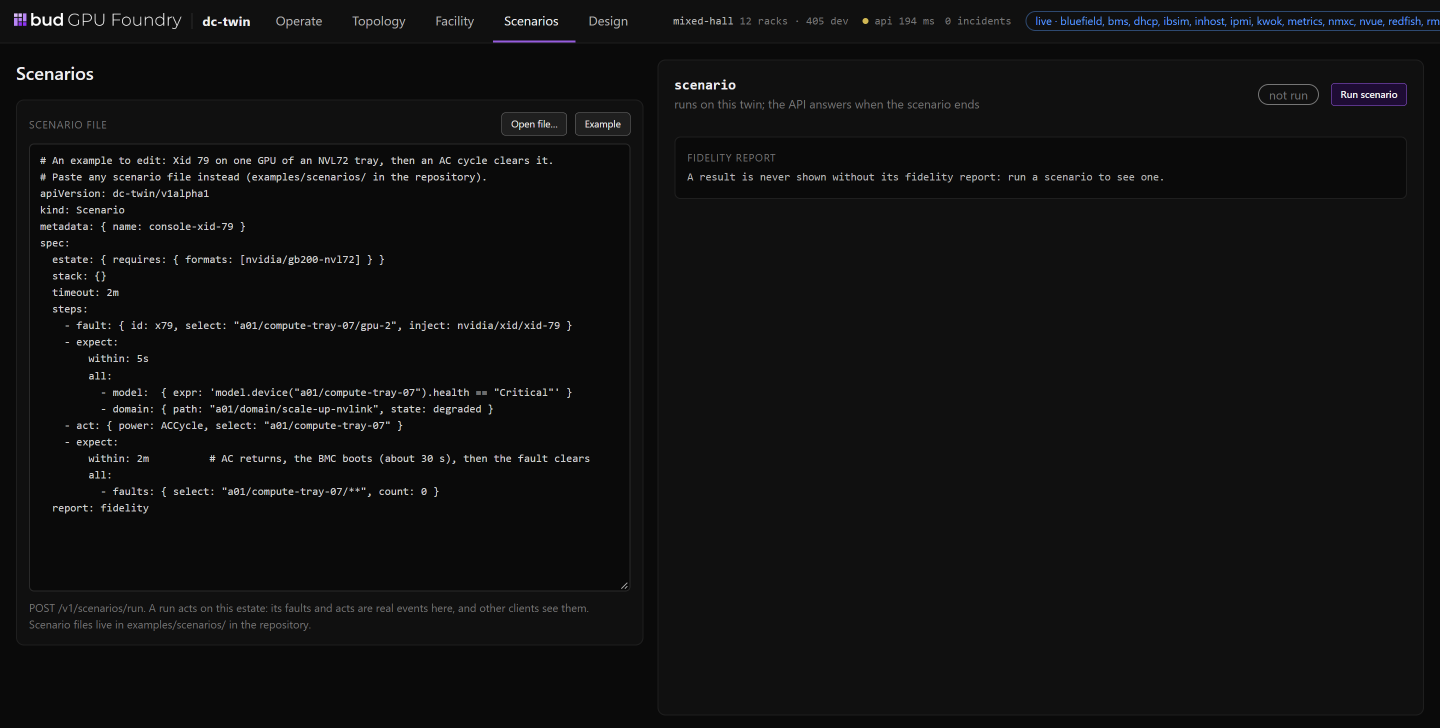
The example in the screenshot injects an Xid 79 fault on one GPU of an NVL72 compute tray. It then expects, within five seconds, that the device is reported Critical and that the rack's scale-up NVLink domain is degraded. The next step is an AC cycle on the tray, and the final expectation is that, within two minutes, no faults remain. The scenario ends with a fidelity report, and a result is never shown without one.
Instead of waiting for real hardware or a real incident, your team can test against the twin, again and again, at any time. A scenario that passes today can be re-run after every change to the design.
Design: decide before you buy
The Design tab is where DC Twin is most useful if you are still planning your facility. You lay out the hall, choose your hardware and add racks, and the twin checks the design as you go.
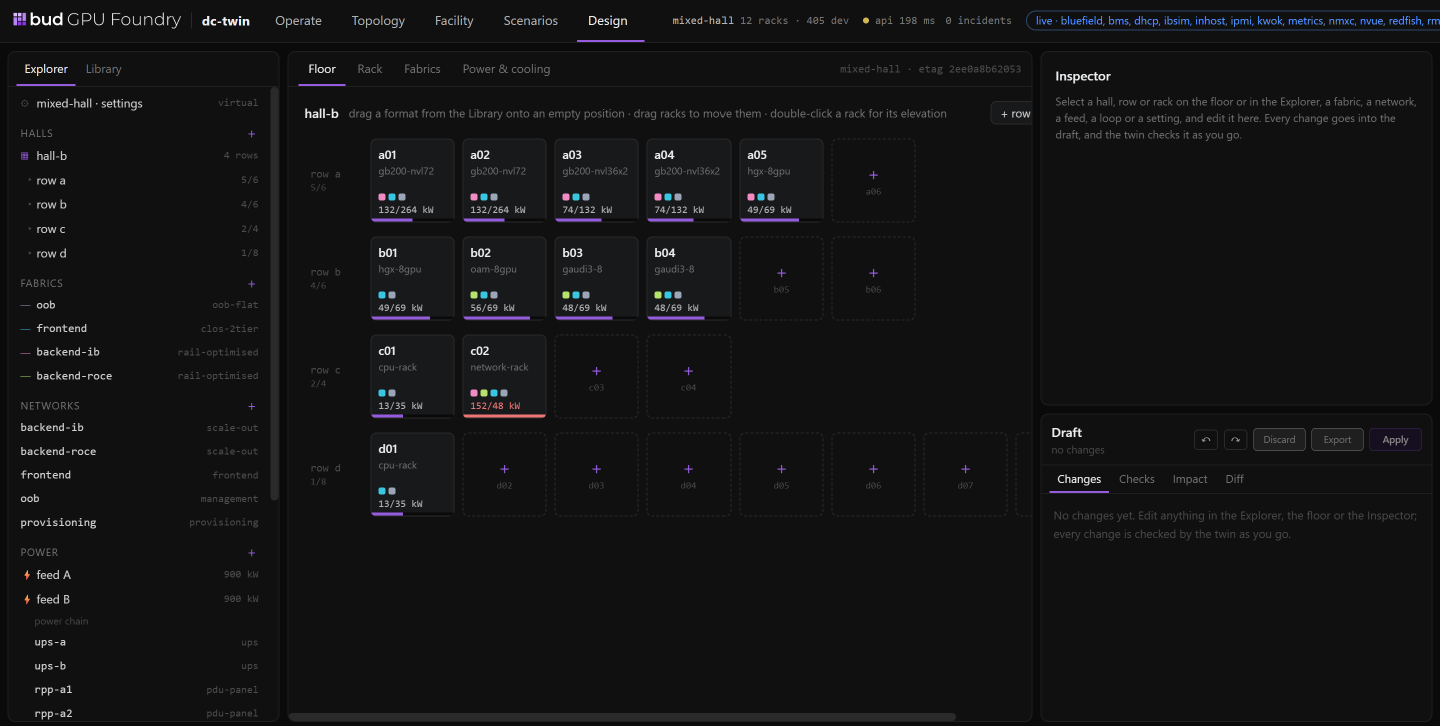
Each rack tile shows its format and its power draw against its capacity, so an overloaded rack is visible on the floor itself: in the example, rack c02 is flagged red at 152 kW against 48 kW. Changes collect in a draft with its own checks and impact views, and nothing reaches the twin until you apply it. It tells you whether you have the power, the cooling and the network capacity to support what you have drawn.
For organisations building sovereign AI capacity, this is the point where it pays for itself. You make confident decisions before committing budget to equipment, and you avoid costly changes once the hardware has arrived. To size the AI workload itself before you buy hardware, see Bud Simulator and the post on how it works.
Who it is for
- Government and public-sector organisations building sovereign AI. Plan and validate the facility before you invest in it.
- Regulated industries such as banking, insurance and defence. Prepare your team to run AI on-premise without risking live systems.
- Anyone running mixed hardware. Because the twin works across vendors, you plan the hall you will actually have, not one supplier's reference design.
Plan, test and operate with confidence
For organisations that want to own and run their AI infrastructure, DC Twin is a way to plan, test and operate with confidence, long before the facility carries real workloads. It is available now as part of Bud GPU Foundry. If you would like to see how it would work for your hall, request a demo and a solutions architect will walk you through it on your own design.